Understanding optimization results
A single-seed call to vamos.optimize(...) returns an OptimizationResult. This guide explains how to read that object before you save it, rank solutions, or turn the run into a study.
Quickstart · Results API · NSGA-II guide
Start with X and F
Run the same small example used by the Quickstart:
from vamos import optimize

result = optimize(
    "zdt1",
    algorithm="nsgaii",
    pop_size=40,
    max_evaluations=400,
    engine="numpy",
    seed=42,
)

print(result.X.shape)
print(result.F.shape)
print(result.data["evaluations"])
For this run, both arrays have 40 rows. Their rows correspond: when X is available, result.X[i] is one decision vector and result.F[i] contains the objective values obtained for that same decision. ZDT1 has 30 decision variables and two objectives, so the shapes are (40, 30) and (40, 2) here.
The evaluation budget is not the number of returned rows. result.data["evaluations"] is 400 because the optimizer evaluated 400 candidate solutions over the run and returned its final result set.
Separate the returned set from its non-dominated subset
OptimizationResult.front() Pareto-filters the objective rows currently stored in result.F. Ask for indices when you also need the matching decisions:
front_F, front_indices = result.front(return_indices=True)
front_X = result.X[front_indices]

print(front_F.shape)
print(front_X.shape)
The indices refer to the current top-level X/F arrays. front() does not silently switch to an external archive or to another hidden population.
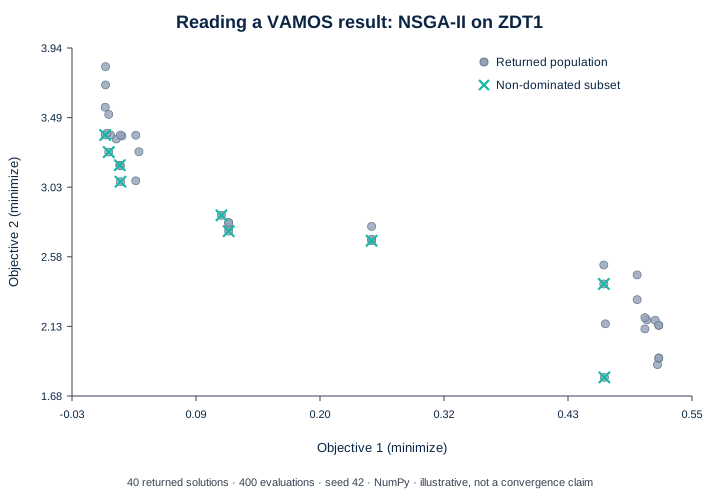
Illustrative first run: NumPy, seed 42, population 40, 400 evaluations. The figure is generated by the linked example. Its purpose is to explain result structure; it is not evidence of convergence or comparative algorithm quality.
For a minimization problem, a point is dominated when another point is no worse in every objective and strictly better in at least one. The crosses therefore identify the trade-off boundary of this returned set. They are not automatically the true Pareto front of the mathematical problem.
Know which set X and F represent
Do not infer the top-level result source from pop_size alone. Result selection is part of the algorithm configuration.
For the simple NSGA-II call above, VAMOS synthesizes the algorithm configuration and resolves result_mode="population"; top-level X and F therefore contain the final population. You can inspect the resolved choice instead of relying on memory:
resolved = result.explain_defaults()["resolved_spec"]
print(resolved["algorithm"]["config"]["result_mode"])
When you pass an explicit NSGAIIConfig, its result mode governs the top-level arrays. The NSGA-II configuration-level default is non_dominated, while an explicit external archive can become the result source unless population mode is requested. The full final NSGA-II population remains available as result.data["population"]; when an archive is enabled its contents are also exposed as result.data["archive"].
These are NSGA-II result-mode rules, not a universal assumption for every algorithm. Use the algorithm contracts when changing algorithms or configuring an archive.
Inspect before selecting one solution
Multi-objective optimization normally returns alternatives, not a single universally best point. First inspect the objective ranges and the shape of the non-dominated subset. Selection helpers such as best() apply an additional decision rule; that rule is not part of Pareto dominance and should be reported when it affects a scientific conclusion.
The exact public methods and properties of OptimizationResult are generated in the Results API. Analysis and plotting helpers live under the public vamos.ux.api surface and are documented separately in Analysis & Visualization.
Reproduce the example
The maintained repository example runs the same 400-evaluation configuration and can optionally write the SVG above without requiring plotting dependencies:
python examples/journeys/understand_results.py
python examples/journeys/understand_results.py --plot understanding-results.svg
The script refuses to overwrite an existing SVG. The documentation smoke suite executes the no-output form so the learning path remains checked without creating files.
Continue when the result makes sense
Once you can identify the decisions, objectives, returned set and non-dominated subset, continue with Solve your own problem. For durable evidence, use Run artifacts & replay; for multiple algorithms, problems or seeds, use Durable studies.