Measure backend time without hiding initialization
Goal: measure a fixed optimization workload and separate first-call costs from subsequent executions. Read backend roles first. This is a local end-to-end timing example, not a package performance ranking.
The script runs NSGA-II on 10-variable ZDT1 with population 40 and 400 evaluations. Each of NumPy, Numba and MooCore receives one first measured call with seed 42, followed by three fresh runs with seeds 0/1/2. Subsequent backend order rotates. Every call creates fresh optimizer state: 12 calls and 4,800 actual objective evaluations in the recorded run.
The timer wraps optimize(), including its setup and the selected backend’s initialization as reached by that call. It excludes problem construction, plotting, file writes and subsequent HV measurement. The first measured call may encounter an existing disk cache; it is not guaranteed to be a completely cold-machine experiment.
Run the complete example
Prerequisites: coverage setup and T06–T08. Download the script below and choose a new output directory. The wrapper refuses an existing directory.
python performance.py --output performance-example
Complete runnable script
"""Verified VAMOS 1.0.1 lesson: performance. See coverage-setup for dependencies."""


def new_output(output):
    from pathlib import Path

    path = Path(output)
    path.mkdir(parents=True, exist_ok=False)
    return path


def write_observations(output, data):
    import json

    (output / "observations.json").write_text(json.dumps(data, indent=2, allow_nan=False) + "\n", encoding="utf-8")
    return data


def run_performance_example(output, budget=400, repeats=3, backends=("numpy", "numba", "moocore")):
    import importlib.metadata
    import os
    import platform
    import statistics
    import time

    from moocore import hypervolume

    from vamos import optimize
    from vamos.algorithms import NSGAIIConfig
    from vamos.problems import ZDT1

    if budget < 40 or repeats < 1 or not backends or len(set(backends)) != len(backends):
        raise ValueError("Use budget >= 40, positive repeats and distinct backends.")
    output = new_output(output)
    config = NSGAIIConfig.default(pop_size=40, n_var=10)
    data = {
        "kind": "performance",
        "budget": budget,
        "repeats": repeats,
        "reference_point": [1.1, 11.0],
        "environment": {
            "python": platform.python_version(),
            "system": platform.system(),
            "release": platform.release(),
            "machine": platform.machine(),
            "processor": platform.processor(),
            "logical_cpus": os.cpu_count(),
            "packages": {p: importlib.metadata.version(p) for p in ("vamos-optimization", "numpy", "scipy", "numba", "moocore")},
            "threads": {
                k: os.environ.get(k, "unset") for k in ("OMP_NUM_THREADS", "OPENBLAS_NUM_THREADS", "MKL_NUM_THREADS", "NUMBA_NUM_THREADS")
            },
        },
        "rows": [],
    }
    # First measured call in this process is not a guaranteed empty OS/JIT disk cache.
    schedule = [("first", backend, 42) for backend in backends]
    for seed in range(repeats):
        order = backends[seed % len(backends) :] + backends[: seed % len(backends)]
        schedule.extend(("subsequent", backend, seed) for backend in order)
    for phase, backend, seed in schedule:
        problem = ZDT1(n_var=10)
        started = time.perf_counter()
        result = optimize(problem, algorithm="nsgaii", algorithm_config=config, max_evaluations=budget, seed=seed, engine=backend)
        elapsed = time.perf_counter() - started
        data["rows"].append(
            {
                "phase": phase,
                "backend": backend,
                "seed": seed,
                "seconds": elapsed,
                "evaluations": int(result.data["evaluations"]),
                "hv": float(hypervolume(result.front(), ref=data["reference_point"])),
            }
        )
    for backend in backends:
        first = next(r["seconds"] for r in data["rows"] if r["backend"] == backend and r["phase"] == "first")
        samples = [r["seconds"] for r in data["rows"] if r["backend"] == backend and r["phase"] == "subsequent"]
        print(
            f"{backend}: first {first:.6f}s; subsequent median {statistics.median(samples):.6f}s; "
            f"range [{min(samples):.6f}, {max(samples):.6f}]s"
        )
    print(f"Actual evaluations: {sum(r['evaluations'] for r in data['rows'])}; fresh optimizer state for every call.")
    print("Times describe this machine and tiny workload; no universal backend ranking follows.")
    return write_observations(output, data)


def advanced_cli(function):
    import argparse

    parser = argparse.ArgumentParser(description="Run a bounded workflow in a new output directory.")
    parser.add_argument("--output", required=True)
    args = parser.parse_args()
    function(args.output)


if __name__ == "__main__":
    advanced_cli(run_performance_example)
Recorded output
numpy: first 0.018157s; subsequent median 0.015707s; range [0.015278, 0.015735]s
numba: first 0.226595s; subsequent median 0.004910s; range [0.004663, 0.005652]s
moocore: first 0.008319s; subsequent median 0.006352s; range [0.006193, 0.006411]s
Actual evaluations: 4800; fresh optimizer state for every call.
Times describe this machine and tiny workload; no universal backend ranking follows.
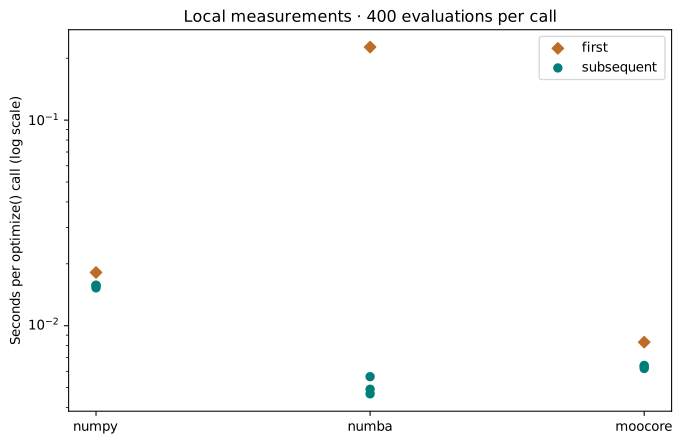
Measured with VAMOS 1.0.1; the observations and provenance retain the inputs and results.
Interpret the measurements and limits
The report retains each duration, phase, backend, seed, evaluation count and final HV, plus Python/package versions, operating system, architecture, CPU count and thread environment. Set thread limits before starting Python for a controlled comparison, for example in a POSIX shell:
OMP_NUM_THREADS=1 OPENBLAS_NUM_THREADS=1 MKL_NUM_THREADS=1 NUMBA_NUM_THREADS=1 python performance.py --output timings-one-thread
On PowerShell, set those environment variables through $env:NAME="1" before the same Python command. Exact dependency versions are in the setup.
The logarithmic figure shows every timing sample and labels first versus subsequent calls. No backend is silently substituted when an optional backend is unavailable. First-call JIT work, cache state, timer overhead, CPU scheduling, competing workloads and thread settings can dominate this tiny example. Median and range over three subsequent samples are descriptive, not a confidence interval. HV is retained to detect changes in search outcomes; equal budgets alone do not prove identical algorithms or results across numerical implementations.
For a meaningful performance claim, use representative objective costs, larger budgets, repeated isolated processes and controlled hardware. Distinguish objective-evaluation time from optimization overhead. Check quality and exact evaluation counts alongside elapsed time.
Try one controlled change
Increase the budget to 4,000 in the script and use a new output directory. Keep thread settings and configuration fixed; compare whether initialization still dominates. Do not reuse a previous run’s optimizer state.
Next: use T08 to report a prespecified experiment with its failures, assumptions and evidence. Consult stability and versioning before depending on Experimental interfaces.