T08. Turn study results into a report
Goal
Create tables, plots, and a bounded interpretation from saved observations; trace a reported group back to its runs; and separate descriptive summaries from inferential claims.
Before you start
| Item | This lesson |
|---|---|
| Prerequisites | T07 measurements, or the downloadable recorded observations |
| Tested environment | VAMOS 1.0.1, MooCore 0.3.2, Matplotlib 3.10.9; setup |
| Interface status | Experimental vamos.ux.api.compute_ranks and plot_hv_convergence; ordinary Python CSV/JSON and Matplotlib |
| Work | Recompute/validate metrics from retained fronts and render; no optimization executes |
Define the report before reading a winner
Use one row per problem/algorithm/budget group and retain all stochastic repeats. The report shows the median and Q1/Q3 of HV and IGD+ with their directions. Quartiles use NumPy's explicit linear interpolation rule. They summarize the sample's variability; they are not confidence intervals or a statistical test.
The per-run CSV keeps the task, selected attempt, run ID, manifest path/hash, seed, budget and state. It lets a reader trace a table cell to each contributing observation. The original canonical study remains the authority for execution and recovery.
Complete code
Download t08-study-report.py. Report the small workflow into a new directory:
python t08-study-report.py --measurements results/tutorial-metrics/measurements.json --output results/tutorial-report
Complete runnable script
"""T08: generated from examples/tutorials/study_workflow.py; see study-setup for dependencies."""
def metric_policy():
return {
"objectives": "minimize both; original units; no per-run normalization",
"hv_reference": [1.1, 11.0],
"igd_plus_reference": "201 analytical points, f1 uniformly spaced on [0,1]",
"zdt1_f2": "1 - sqrt(f1)",
"zdt2_f2": "1 - f1**2",
"aggregation": "median and linear-interpolation quartiles within problem/algorithm/budget",
"budget_axis": "separate fresh studies; not checkpoints or a continuous trajectory",
}
def measure_front(problem, front):
import numpy as np
from moocore import hypervolume, igd_plus
values = np.asarray(front, dtype=float)
if values.ndim != 2 or values.shape[1] != 2 or not len(values) or not np.isfinite(values).all():
raise ValueError("Expected a nonempty finite two-objective front.")
if problem not in {"zdt1", "zdt2"}:
raise ValueError("This tutorial defines references only for zdt1 and zdt2.")
reference_point = np.array(metric_policy()["hv_reference"])
if np.any(values >= reference_point):
raise ValueError("A point lies outside the declared HV reference box; review the protocol.")
x = np.linspace(0.0, 1.0, 201)
y = 1.0 - np.sqrt(x) if problem == "zdt1" else 1.0 - x**2
reference_front = np.column_stack([x, y])
return {
"hv": float(hypervolume(values, ref=reference_point)),
"igd_plus": float(igd_plus(values, ref=reference_front)),
}
def summarize_measurements(dataset):
import hashlib
import itertools
import json
import numpy as np
from vamos.ux.api import compute_ranks
if dataset.get("schema") != "vamos.documentation.study-measurements.v1" or dataset["policy"] != metric_policy():
raise ValueError("Unsupported tutorial measurement schema or policy.")
rows = dataset["rows"]
expected = set()
for study in dataset["studies"]:
matrix = study["intent"]["matrix"]
if study["state"] != "completed" or study["issues"]:
raise ValueError("Resolve incomplete studies or inspection issues before reporting.")
for problem, algorithm, seed in itertools.product(matrix["problems"], matrix["algorithms"], matrix["seeds"]):
expected.add((study["study_id"], problem, algorithm, seed, study["budget"]))
keys = [(r["study_id"], r["problem"], r["algorithm"], r["seed"], r["evaluation_budget"]) for r in rows]
if not expected or len(keys) != len(set(keys)) or set(keys) != expected:
raise ValueError("Missing or duplicate planned observations; do not silently change the sample.")
for row in rows:
if row["state"] != "succeeded" or row["evaluations"] != row["evaluation_budget"]:
raise ValueError("Resolve failed/incomplete runs or unequal evaluation budgets before reporting.")
front_hash = hashlib.sha256(json.dumps(row["front"], separators=(",", ":")).encode()).hexdigest()
if front_hash != row["front_sha256"]:
raise ValueError("The retained objective front has changed.")
actual = measure_front(row["problem"], row["front"])
if any(not np.isfinite(row[name]) or not np.isclose(row[name], actual[name], rtol=1e-12, atol=1e-12) for name in actual):
raise ValueError("A metric does not match its retained objective front.")
groups = []
for key in sorted({(r["problem"], r["algorithm"], r["evaluation_budget"]) for r in rows}):
selected = [r for r in rows if (r["problem"], r["algorithm"], r["evaluation_budget"]) == key]
group = dict(zip(("problem", "algorithm", "budget"), key))
group["n"] = len(selected)
for metric in ("hv", "igd_plus"):
q1, median, q3 = np.quantile([r[metric] for r in selected], [0.25, 0.5, 0.75], method="linear")
group.update({f"{metric}_q1": float(q1), f"{metric}_median": float(median), f"{metric}_q3": float(q3)})
groups.append(group)
final_budget = max(g["budget"] for g in groups)
problems, algorithms = sorted({g["problem"] for g in groups}), sorted({g["algorithm"] for g in groups})
matrix = np.array(
[
[
next(g["hv_median"] for g in groups if (g["problem"], g["algorithm"], g["budget"]) == (p, a, final_budget))
for a in algorithms
]
for p in problems
]
)
ranks = compute_ranks(matrix, higher_is_better=True)
return {
"groups": groups,
"final_budget": final_budget,
"problems": problems,
"algorithms": algorithms,
"scores": matrix.tolist(),
"ranks": ranks.tolist(),
}
def save_tutorial_figure(fig, path):
fig.savefig(path, metadata={"Date": None}, bbox_inches="tight")
svg = path.read_text(encoding="utf-8")
path.write_text("\n".join(line.rstrip() for line in svg.splitlines()) + "\n", encoding="utf-8")
def draw_study_figures(dataset, summary, output):
import matplotlib
matplotlib.use("Agg")
import matplotlib.pyplot as plt
import numpy as np
from vamos.ux.api import plot_hv_convergence
with plt.rc_context({"svg.hashsalt": "vamos-study-tutorials", "svg.fonttype": "none", "font.size": 10}):
fig, axes = plt.subplots(1, len(summary["problems"]), figsize=(10, 4), squeeze=False, layout="constrained")
for ax, problem in zip(axes[0], summary["problems"]):
for algorithm in summary["algorithms"]:
groups = sorted(
(g for g in summary["groups"] if g["problem"] == problem and g["algorithm"] == algorithm), key=lambda g: g["budget"]
)
budgets = np.array([g["budget"] for g in groups])
plot_hv_convergence(budgets, np.array([g["hv_median"] for g in groups]), ax=ax, label=algorithm, title=problem.upper())
ax.lines[-1].set_marker("o")
if len(groups) == 1:
g = groups[0]
ax.errorbar(
budgets,
[g["hv_median"]],
yerr=[[g["hv_median"] - g["hv_q1"]], [g["hv_q3"] - g["hv_median"]]],
fmt="none",
color=ax.lines[-1].get_color(),
capsize=4,
)
ax.fill_between(budgets, [g["hv_q1"] for g in groups], [g["hv_q3"] for g in groups], alpha=0.15)
ax.set_xlabel("Evaluation budget per fresh run")
ax.set_ylabel("Hypervolume (higher is better)")
ax.grid(alpha=0.2)
fig.suptitle("Median and IQR across seeds · separate runs, not a continuous trajectory")
save_tutorial_figure(fig, output / "budget-comparison.svg")
plt.close(fig)
fig, axes = plt.subplots(1, len(summary["problems"]), figsize=(10, 4), squeeze=False, layout="constrained")
for ax, problem in zip(axes[0], summary["problems"]):
values = [
[
r["igd_plus"]
for r in dataset["rows"]
if r["problem"] == problem and r["algorithm"] == a and r["evaluation_budget"] == summary["final_budget"]
]
for a in summary["algorithms"]
]
ax.boxplot(values, tick_labels=summary["algorithms"], whis=(0, 100), showfliers=False)
for position, sample in enumerate(values, 1):
ax.scatter(np.full(len(sample), position), sample, s=16, c="#007f7a", alpha=0.65, zorder=3)
ax.set(title=problem.upper(), ylabel="IGD+ (lower is better)")
ax.grid(axis="y", alpha=0.2)
fig.suptitle(f"All retained repeats at {summary['final_budget']} evaluations · whiskers show min/max")
save_tutorial_figure(fig, output / "final-distributions.svg")
plt.close(fig)
def render_report(measurements, output):
import csv
import hashlib
import json
from pathlib import Path
output = Path(output)
if output.exists():
raise FileExistsError(f"Choose a new report directory: {output}")
source = Path(measurements)
dataset = json.loads(source.read_text(encoding="utf-8"))
summary = summarize_measurements(dataset)
output.mkdir(parents=True, exist_ok=False)
with (output / "metrics.csv").open("w", newline="", encoding="utf-8") as handle:
fields = [name for name in dataset["rows"][0] if name not in {"front", "failure"}]
writer = csv.DictWriter(handle, fieldnames=fields, extrasaction="ignore", lineterminator="\n")
writer.writeheader()
writer.writerows(dataset["rows"])
with (output / "summary.csv").open("w", newline="", encoding="utf-8") as handle:
writer = csv.DictWriter(handle, fieldnames=list(summary["groups"][0]), lineterminator="\n")
writer.writeheader()
writer.writerows(summary["groups"])
lines = [
"# Descriptive VAMOS study report",
"",
f"Source SHA-256: `{hashlib.sha256(source.read_bytes()).hexdigest()}`",
"",
"All observations come from verified persisted runs. This report does not rerun optimization.",
"",
"| Problem | Algorithm | Budget | Repeats | HV median [Q1, Q3] ↑ | IGD+ median [Q1, Q3] ↓ |",
"| --- | --- | ---: | ---: | --- | --- |",
]
for g in summary["groups"]:
lines.append(
f"| {g['problem']} | {g['algorithm']} | {g['budget']} | {g['n']} | "
f"{g['hv_median']:.6f} [{g['hv_q1']:.6f}, {g['hv_q3']:.6f}] | "
f"{g['igd_plus_median']:.6f} [{g['igd_plus_q1']:.6f}, {g['igd_plus_q3']:.6f}] |"
)
lines += ["", "## What these observations show", ""]
for problem in summary["problems"]:
final = [g for g in summary["groups"] if g["problem"] == problem and g["budget"] == summary["final_budget"]]
comparisons = "; ".join(
f"{g['algorithm']}: median HV {g['hv_median']:.6f}, median IGD+ {g['igd_plus_median']:.6f} ({g['n']} repeats)" for g in final
)
lines += [f"At {summary['final_budget']} evaluations on **{problem}**, {comparisons}.", ""]
lines += [
"Read higher HV and lower IGD+ as better under the declared references. Compare the spreads in the table and plots,",
"then limit any preference to these problems, settings, budgets and observed repeats; it is not evidence of general superiority.",
]
lines += [
"",
"",
"",
"",
"",
"## Interpretation limits",
"",
"These are per-problem descriptive observations, not a general algorithm ranking.",
"Quartiles describe variability; they are not confidence intervals. Shared seed labels do not create paired samples.",
"The budget comparisons use fresh runs and charge every run in full; no continuous convergence history was recorded.",
"Only two problems are included. No p-value, significance claim, or algorithm-wide superiority is reported.",
"Do not average raw HV across different problems. See metrics.csv for each task, selected attempt, run ID and manifest hash.",
"",
]
(output / "report.md").write_text("\n".join(lines), encoding="utf-8")
(output / "descriptive-ranks.json").write_text(json.dumps(summary, indent=2) + "\n", encoding="utf-8")
draw_study_figures(dataset, summary, output)
print(f"Report observations: {len(dataset['rows'])}")
print(f"Problem/algorithm/budget groups: {len(summary['groups'])}")
print(f"Descriptive rank matrix: {len(summary['problems'])} problems x {len(summary['algorithms'])} algorithms")
print("No inferential test: two problems do not support a general superiority claim.")
return summary
def main_t08(argv=None):
import argparse
parser = argparse.ArgumentParser(description="Create a descriptive report from retained, measured observations.")
parser.add_argument("--measurements", required=True)
parser.add_argument("--output", required=True)
args = parser.parse_args(argv)
render_report(args.measurements, args.output)
if __name__ == "__main__":
main_t08()
Observed result
Actual output of that eight-task workflow:
Report observations: 8
Problem/algorithm/budget groups: 4
Descriptive rank matrix: 2 problems x 2 algorithms
No inferential test: two problems do not support a general superiority claim.
The directory contains report.md, metrics.csv, summary.csv, two SVG
figures, and descriptive-ranks.json. The report records the SHA-256 of its
input observations. It refuses missing/duplicate planned observations, incomplete
studies, altered retained fronts, or metrics that no longer match those fronts.
No failure is dropped or assigned a favorable score to make a table complete.
Rebuild the recorded report
Download recorded-measurements.json and run:
python t08-study-report.py --measurements recorded-measurements.json --output results/retained-report
This uses 120 real observations from the larger recorded protocol, not the eight-row smoke example or a hand-written score matrix. View the complete generated report, per-run metrics, and group summaries.
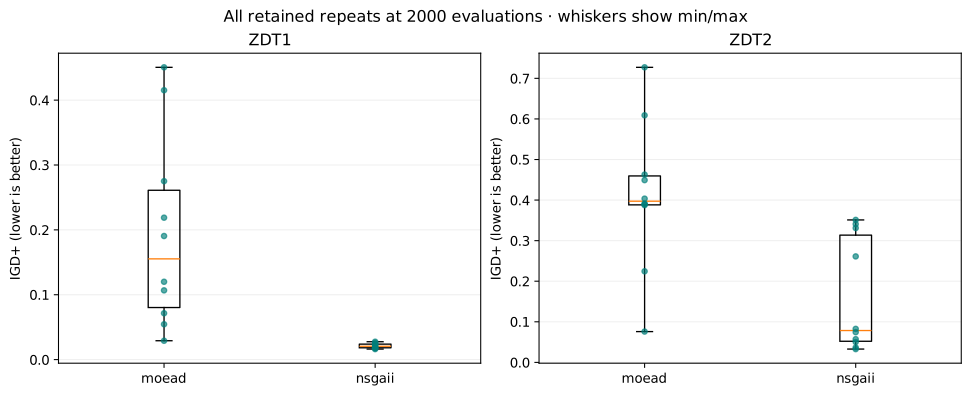
Every dot is one retained repeat. The box shows Q1/median/Q3; whiskers span minimum to maximum. Read each problem panel separately. A distribution visible on these two benchmarks does not establish a framework-wide ranking.
From numbers to justified conclusions
A defensible sentence names the problem, configuration, budget, indicator, replication and observed variability. For example, describe a lower observed median IGD+ at a stated budget, then inspect all repeats and the other indicator. Do not turn that statement into “algorithm A is universally better”.
The experimental compute_ranks helper receives a matrix with one row per
problem and one column per algorithm; each cell is the predeclared median HV
at the final budget. Seeds stay inside their cell. These ranks are descriptive;
they are not a significance result, and raw HV is not averaged across problems.
There are only two problems and two algorithms here, so this report performs no Friedman or Wilcoxon test and draws no critical-distance inference. For an adequately designed larger comparison, the statistical guide describes the existing helpers, matrix orientation, metric direction, and the fact that pairwise p-values are raw and require an explicit multiplicity procedure when appropriate. Identical seed labels alone never justify treating runs as paired.
Try one change
Make a copy of the downloaded observations and remove one row. Report that copy into a new directory. The command must fail with a missing-observations error; it must not silently report a smaller sample. Keep the original data intact. For a changed scientific design, create a new T06 plan and regenerate its observations instead of editing numerical results.
Next step
You now have the full chain from planned tasks to measured observations and a reviewable report. Use Run artifacts & replay to verify/reproduce individual saved runs, and the analysis guide when your experiment supports a broader statistical procedure. Return to Tutorials for other learning paths.