T01. Your first meaningful result
Goal
Run one optimization, identify the decisions and objectives it returns, and explain the difference between a population and its non-dominated subset. You can stop after this lesson with a meaningful first result.
Before you start
| Item | This lesson |
|---|---|
| Prerequisites | Run a Python script; use the Minimal Python Track if needed. |
| Tested package | VAMOS 1.0.1, Python 3.12; setup and exact tested dependencies. |
| Dependencies | Core package only; no plotting extra is needed to execute the download. |
| Interface status | Stable optimize, OptimizationResult, and front; NumPy backend. |
| Run | ZDT1, 30 variables, NSGA-II, population 40, 400 evaluations, seed 42. |
ZDT1 is a built-in two-objective minimization benchmark. This deliberately short run teaches the workflow; its small budget is not evidence of convergence.
Complete code
Download t01-first-result.py and run:
python t01-first-result.py
The downloadable file and this block are generated from the same maintained example. The function returns data for inspection; running the file prints the summary without creating any files.
"""T01: generated from examples/tutorials/fundamentals.py; VAMOS 1.0.1, core dependencies only."""


def run_t01(max_evaluations=400):
    from vamos import optimize

    result = optimize(
        "zdt1",
        algorithm="nsgaii",
        n_var=30,
        pop_size=40,
        max_evaluations=max_evaluations,
        engine="numpy",
        seed=42,
    )
    front_F, indices = result.front(return_indices=True)
    front_X = result.X[indices]
    print(f"Returned decisions: {result.X.shape}")
    print(f"Returned objectives: {result.F.shape}")
    print(f"Non-dominated objectives: {front_F.shape}")
    print(f"Matching decisions: {front_X.shape}")
    print(f"Evaluations: {result.data['evaluations']}")
    return {"result": result, "front_F": front_F, "front_indices": indices}


if __name__ == "__main__":
    run_t01()
Observed result
This is actual output from the installed 1.0.1 wheel in the recorded environment.
Returned decisions: (40, 30)
Returned objectives: (40, 2)
Non-dominated objectives: (9, 2)
Matching decisions: (9, 30)
Evaluations: 400
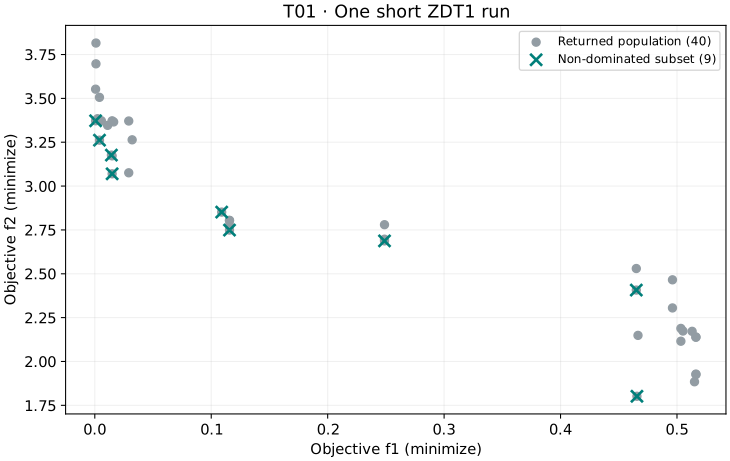
The figure is generated from the same execution as the printed output. It shows returned candidates, not the analytical Pareto front or a second run.
Interpret the result
- Each row of
Xholds 30 decision variables. The same row ofFcontains their two objective values:X[i]andF[i]describe one candidate. - The 400 evaluations are the search budget. They are not the number of solutions returned. In this NSGA-II configuration the returned set is the final population of 40 rows.
- The nine non-dominated rows have no other returned row that is at least as good in both objectives and strictly better in one. This is a statement about the returned candidates, not global optimality.
front(return_indices=True)supplies indices into the current result. Applying those indices toXkeeps decisions and objectives aligned.
These population semantics are specific to this configuration. An external
archive or another algorithm can expose a different result set; consult
result modes
when changing them. front() also does not establish feasibility for a
constrained problem; that is the next lesson.
Try one change
At the bottom of the downloaded script, change the call to
run_t01(max_evaluations=800) and run it again. Keep the population and seed
fixed. Check that the evaluation count changes while X still has 40 rows.
Compare the objective ranges and the number of non-dominated rows.
A larger non-dominated subset alone does not mean better quality. One seed and two small budgets do not establish convergence or algorithm superiority.
Next step
Continue with T02. Solve your own constrained problem. For exact result methods, use the Results API. The complete Quickstart remains available when you are ready to configure, preserve, and organize runs.